Reports, infographics and printed material
Assortment of reports and printed material created over the years, featuring examples of data design and infographics, as long with editorial design.
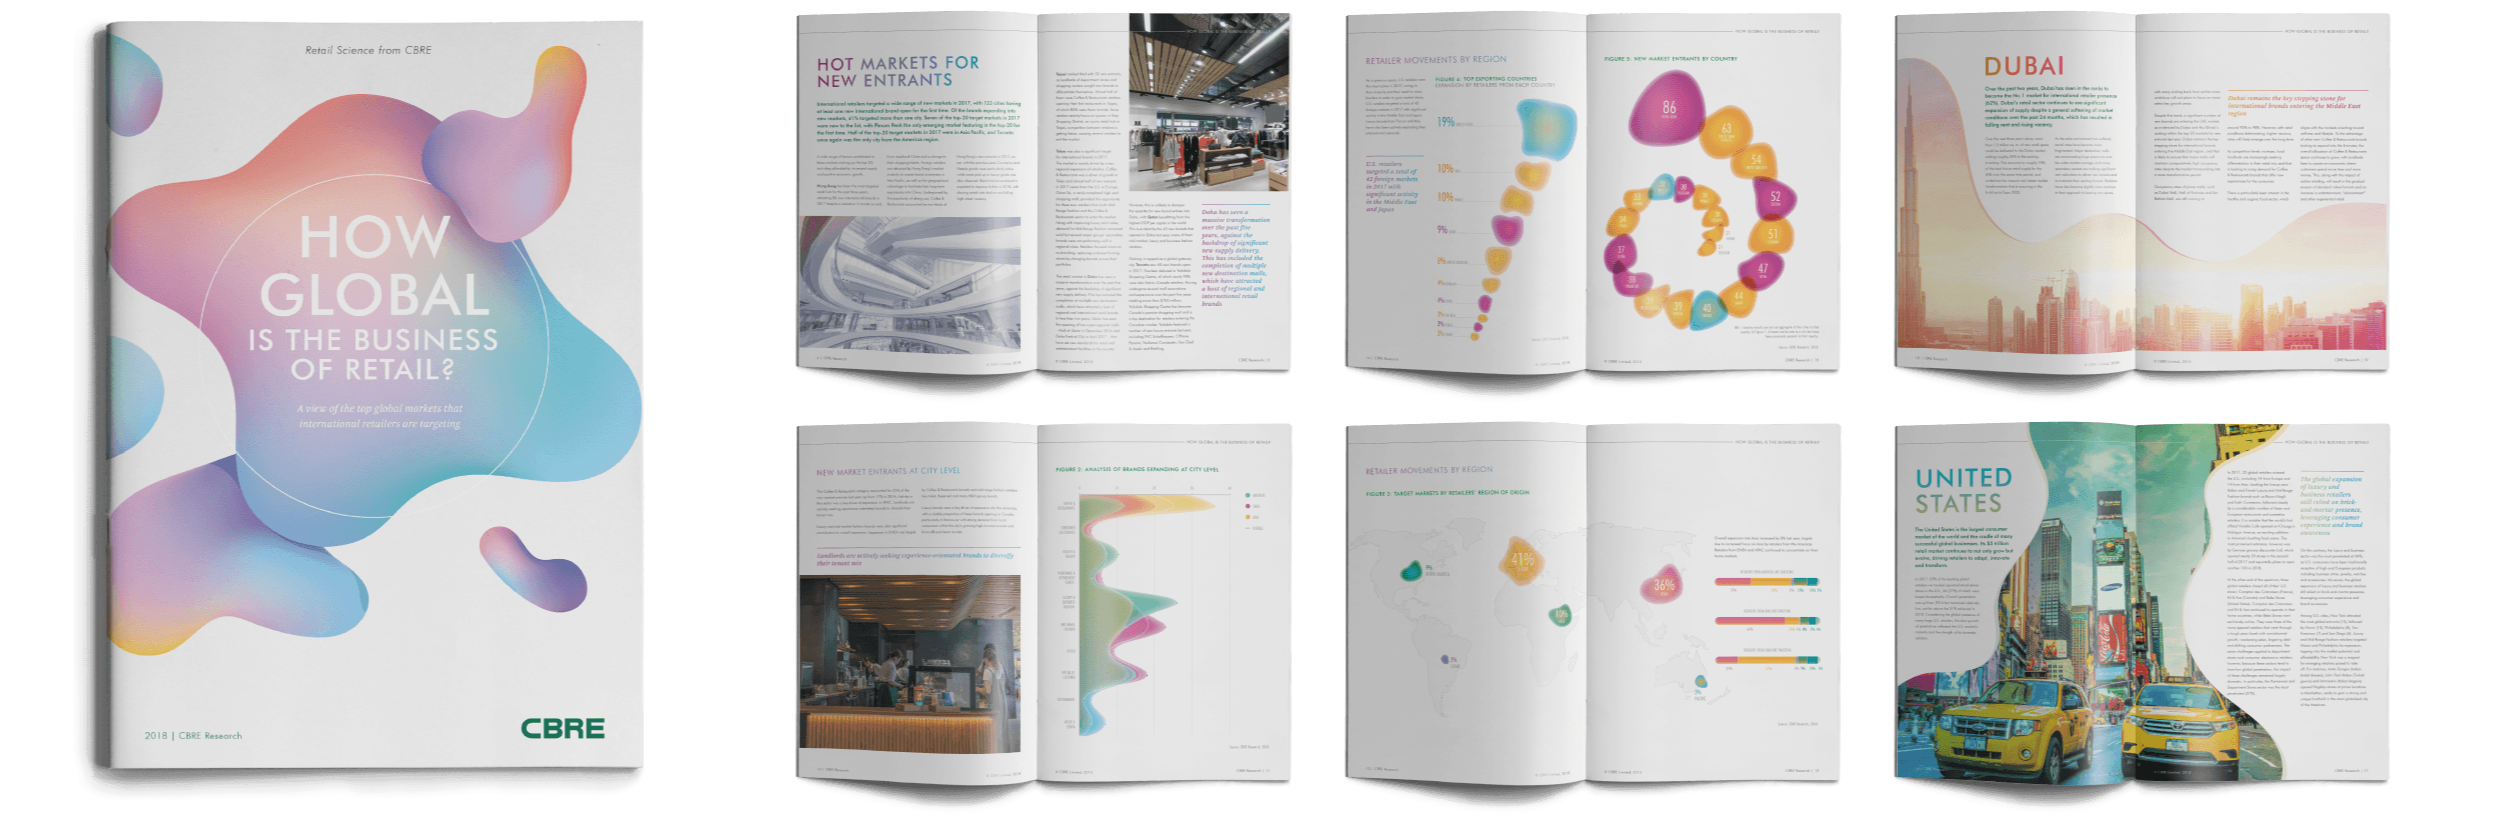
Project 01/07
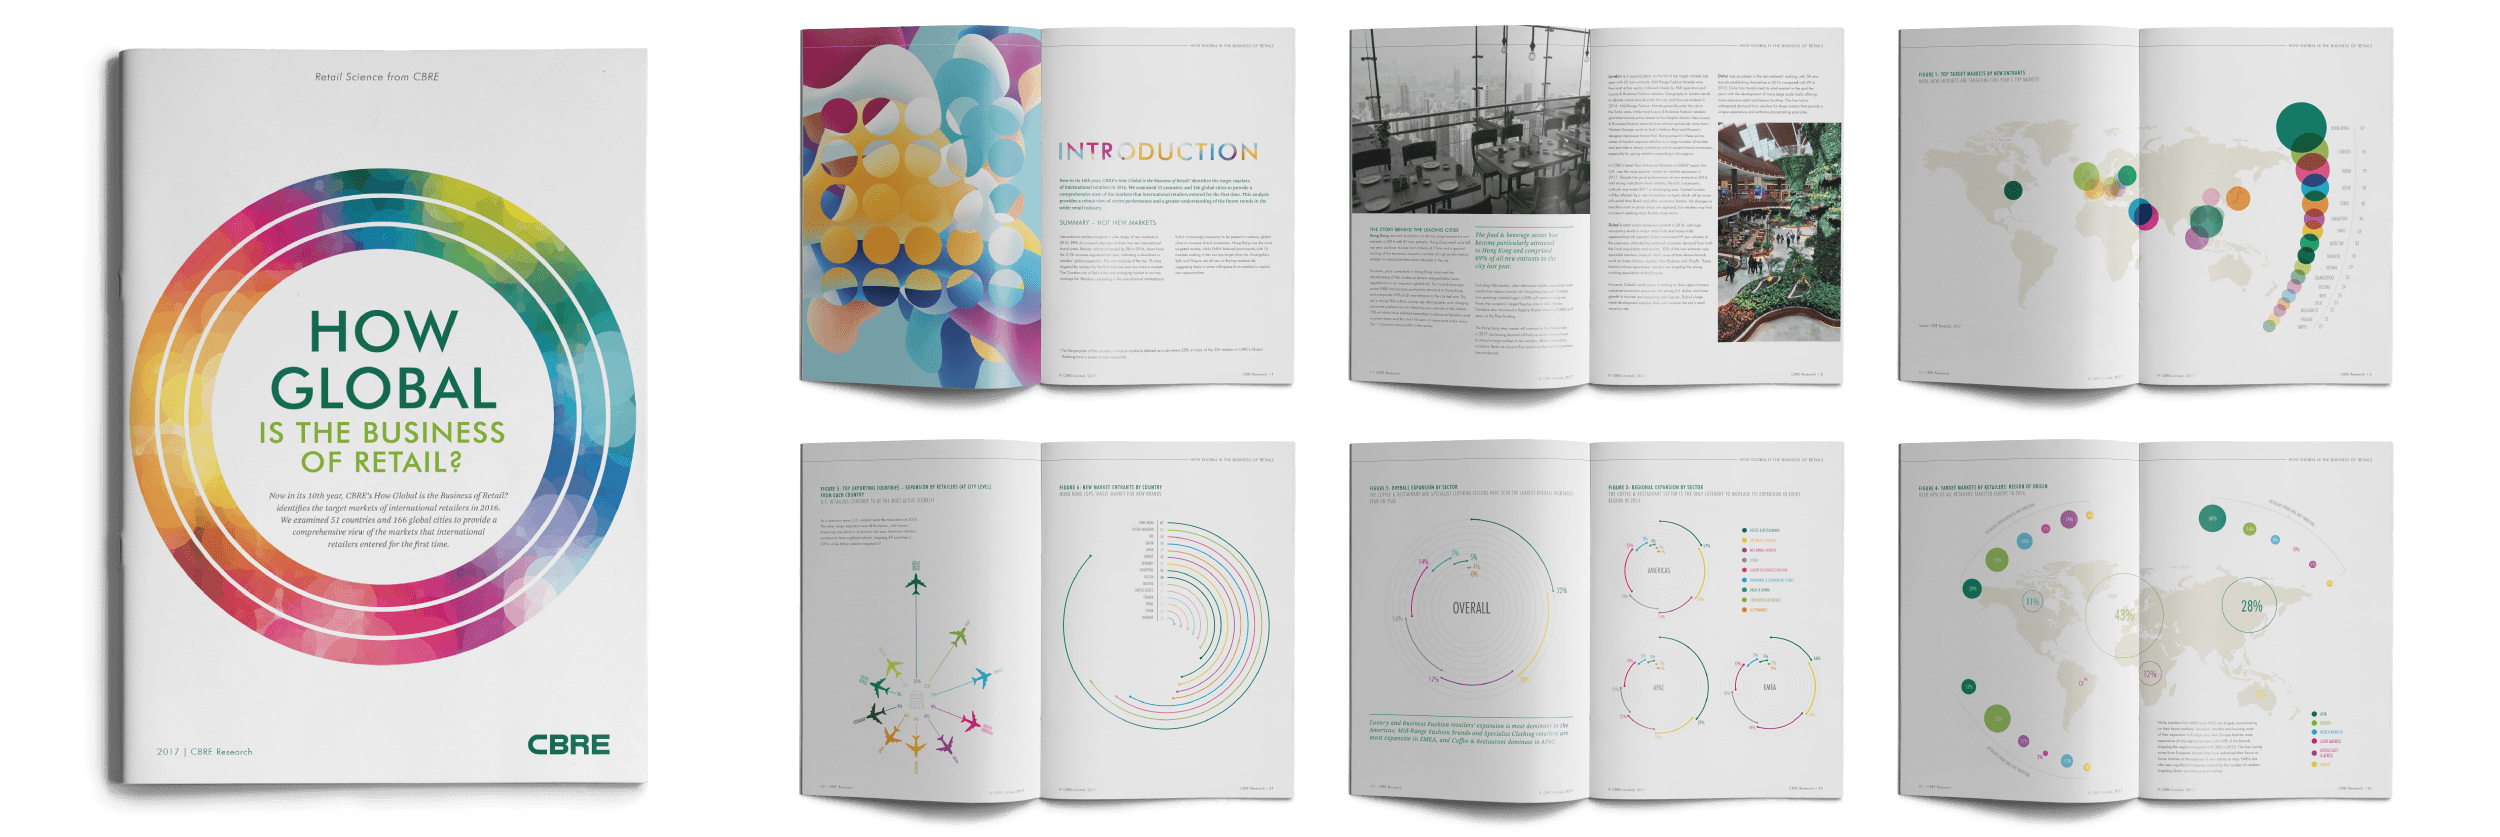
HOW GLOBAL IS THE BUSINESS OF RETAIL? – 2018
Design of charts and layout, evolving the look and feel of the annual retail report, giving each report its own look and feel to differentiate from previous editions.
Skills & tools
Adobe Illustrator
Adobe InDesign
Data design
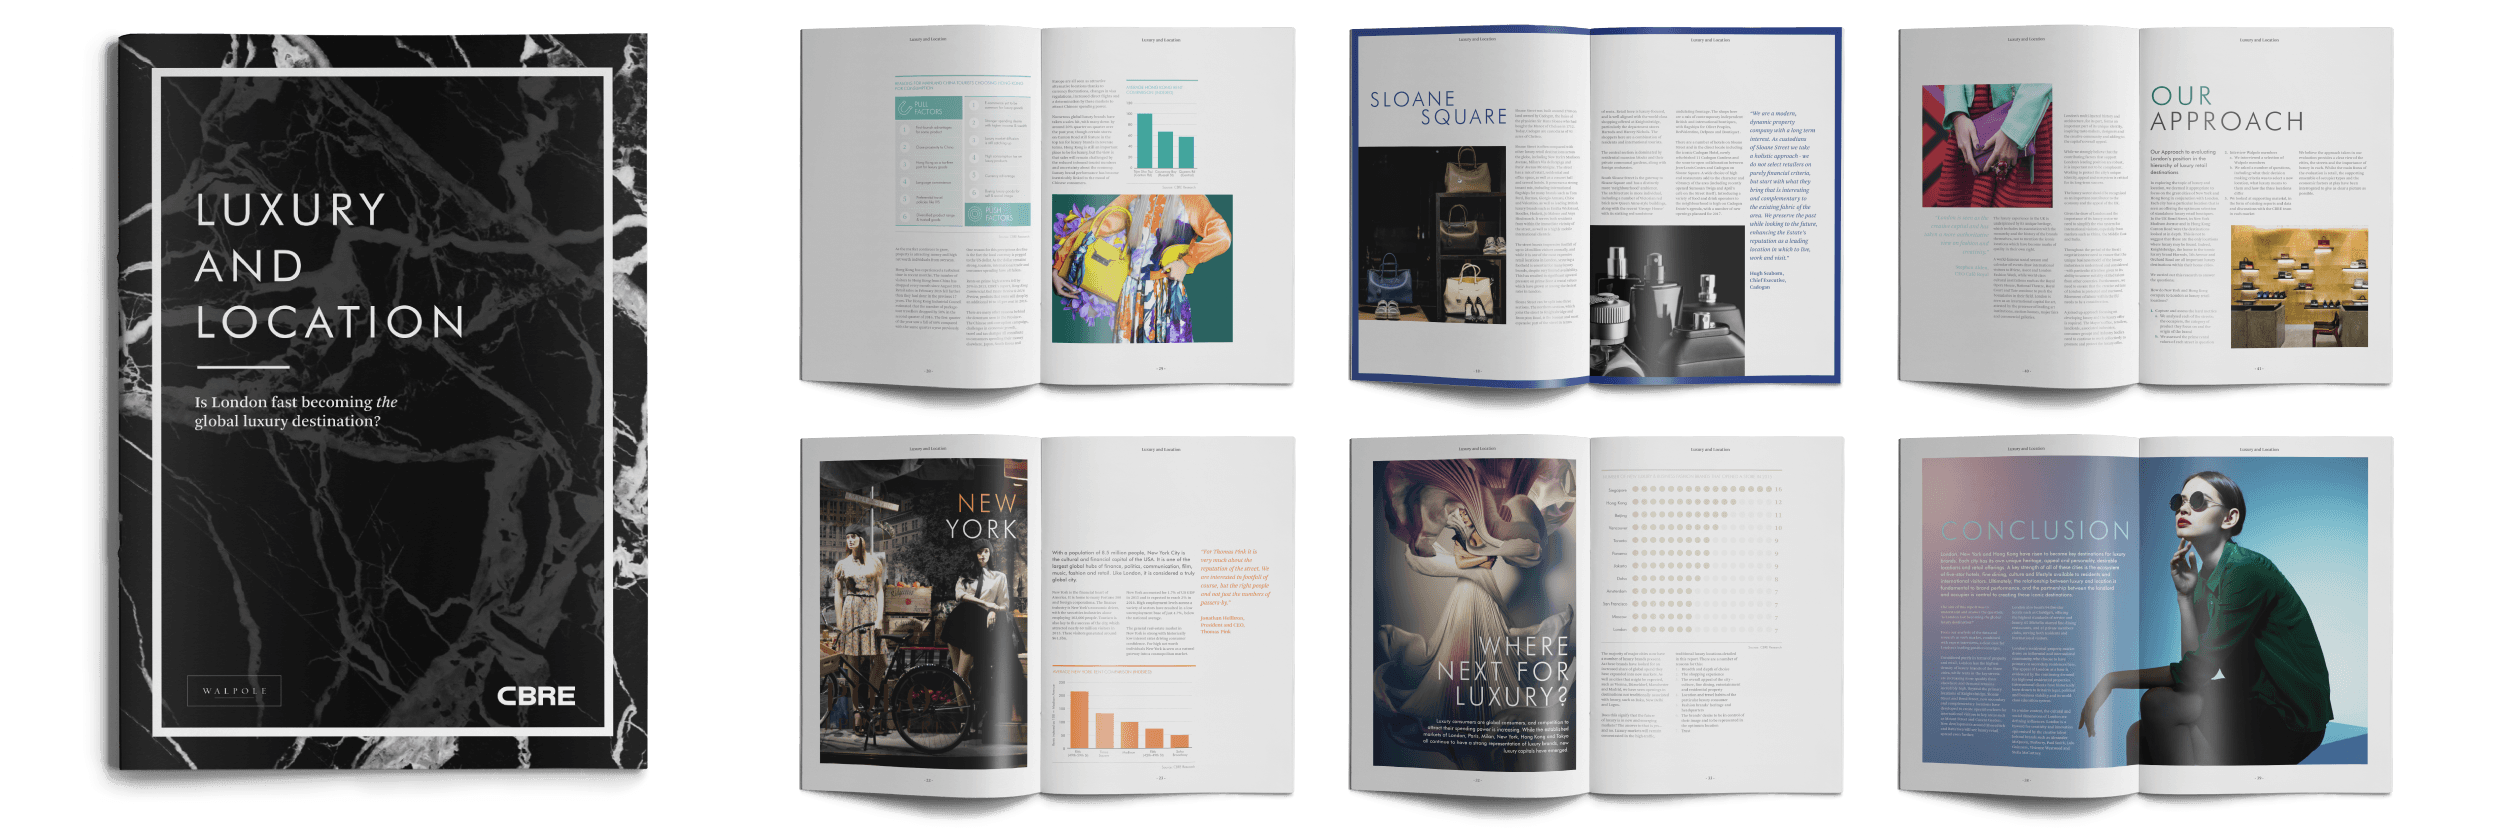
Project 02/07
LUXURY LOCATION REPORT
Editorial design and chart design, along with developing an extended palette.
Skills & tools
Adobe Illustrator
Adobe InDesign
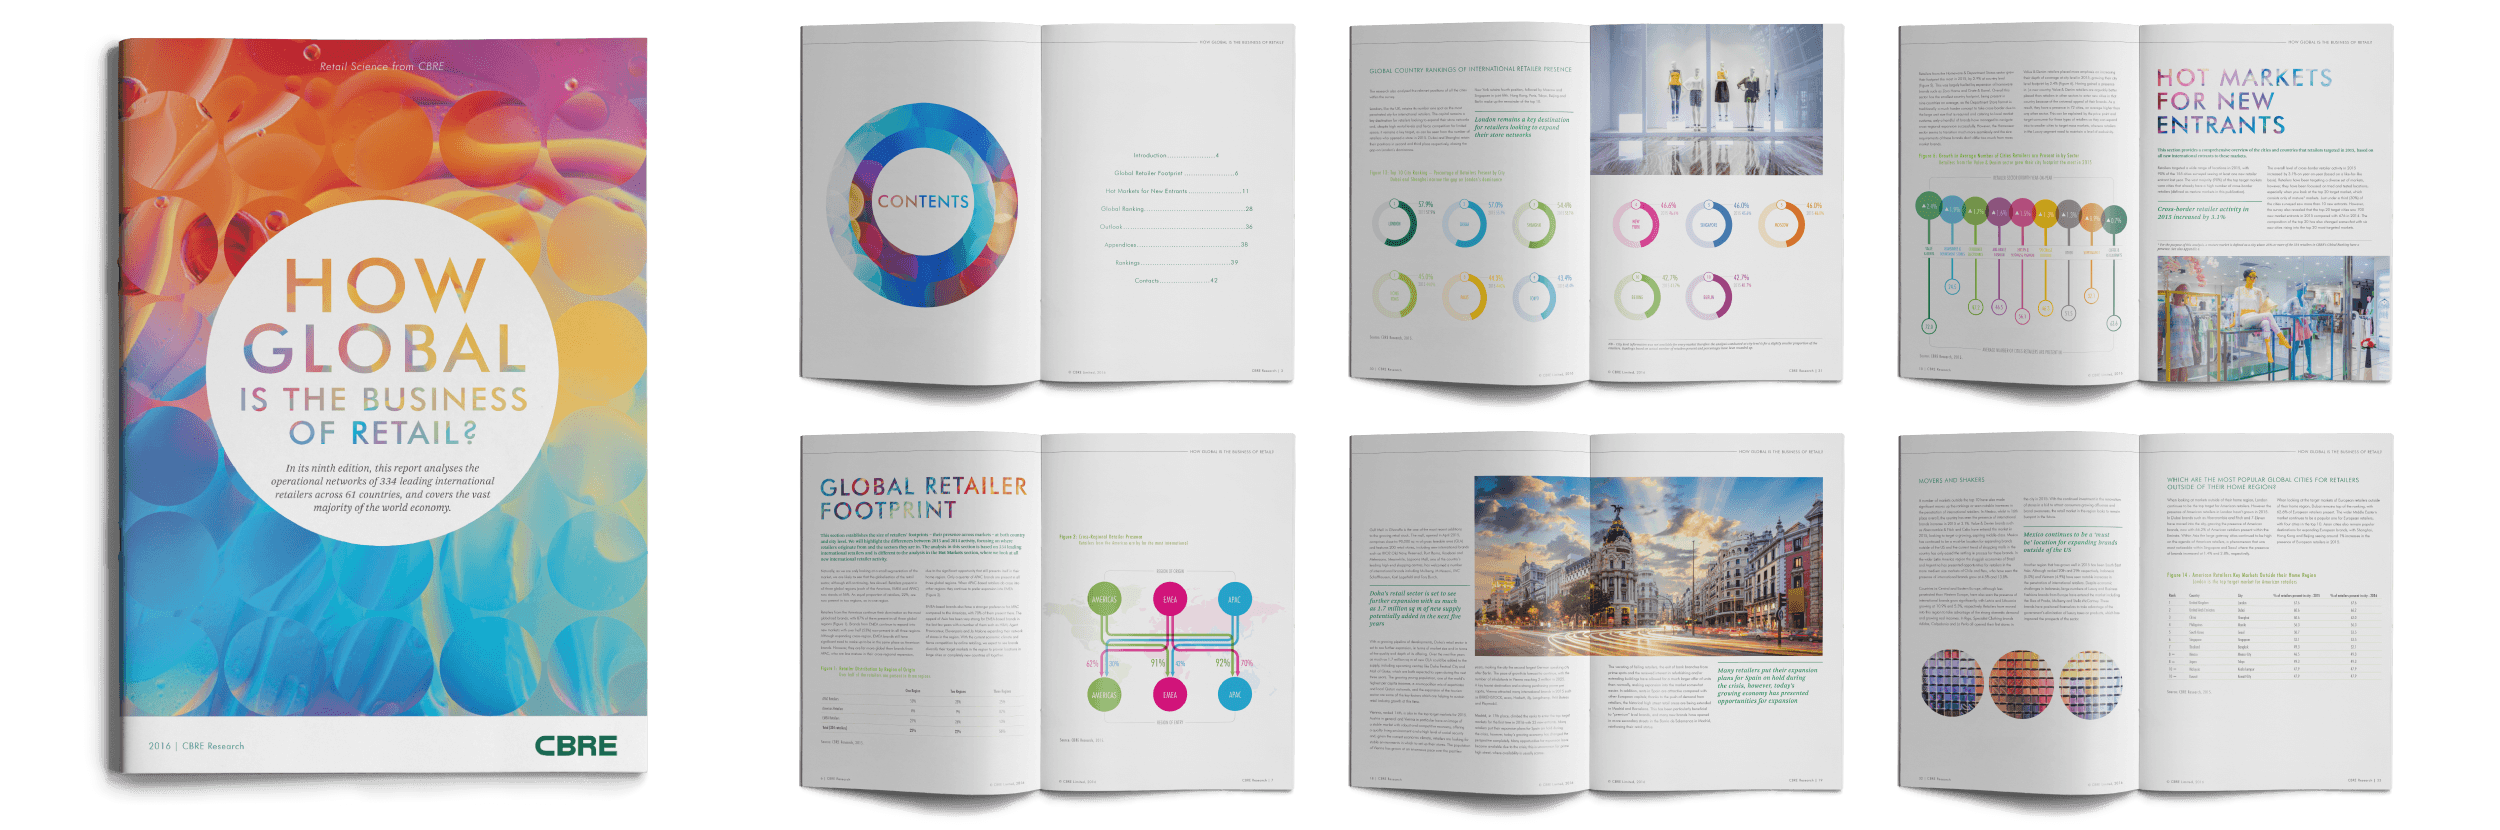
Project 03/07
HOW GLOBAL IS THE BUSINESS OF RETAIL? – 2016
Layout design for the yearly report and setting up the style for this number, inspired by the usage of the circle in the infographics and charts.
Skills & tools
Adobe Illustrator
Adobe InDesign
Project 04/07
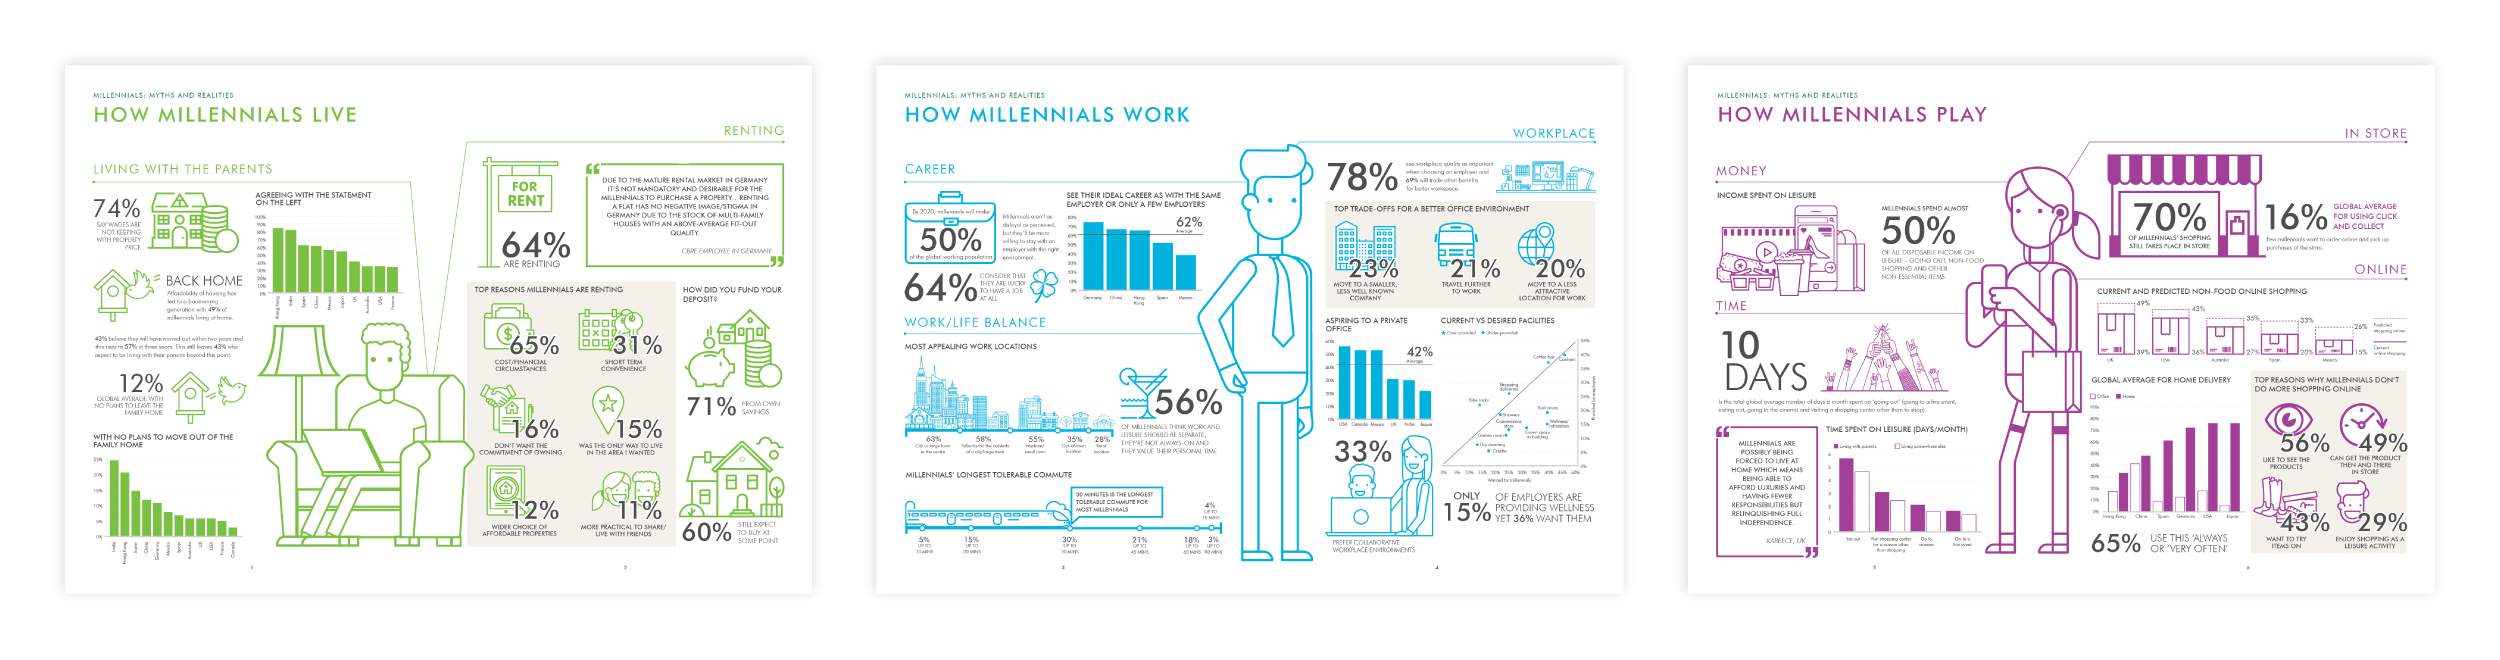
MILLENNIALS: MYTHS AND REALITIES
Creation of illustrative graphics to showcase the top level data, these assets were also used along the report as standalone graphics.
Skills & tools
Adobe Illustrator
Adobe InDesign
Project 05/07
HOW GLOBAL IS THE BUSINESS OF RETAIL? – 2017
Editorial and chart design for the 2017 edition, following the previous year publication, the circles takes centre stage to create new and fresh charts and visuals.
Skills & tools
Adobe Illustrator
Adobe InDesign
Project 04/07
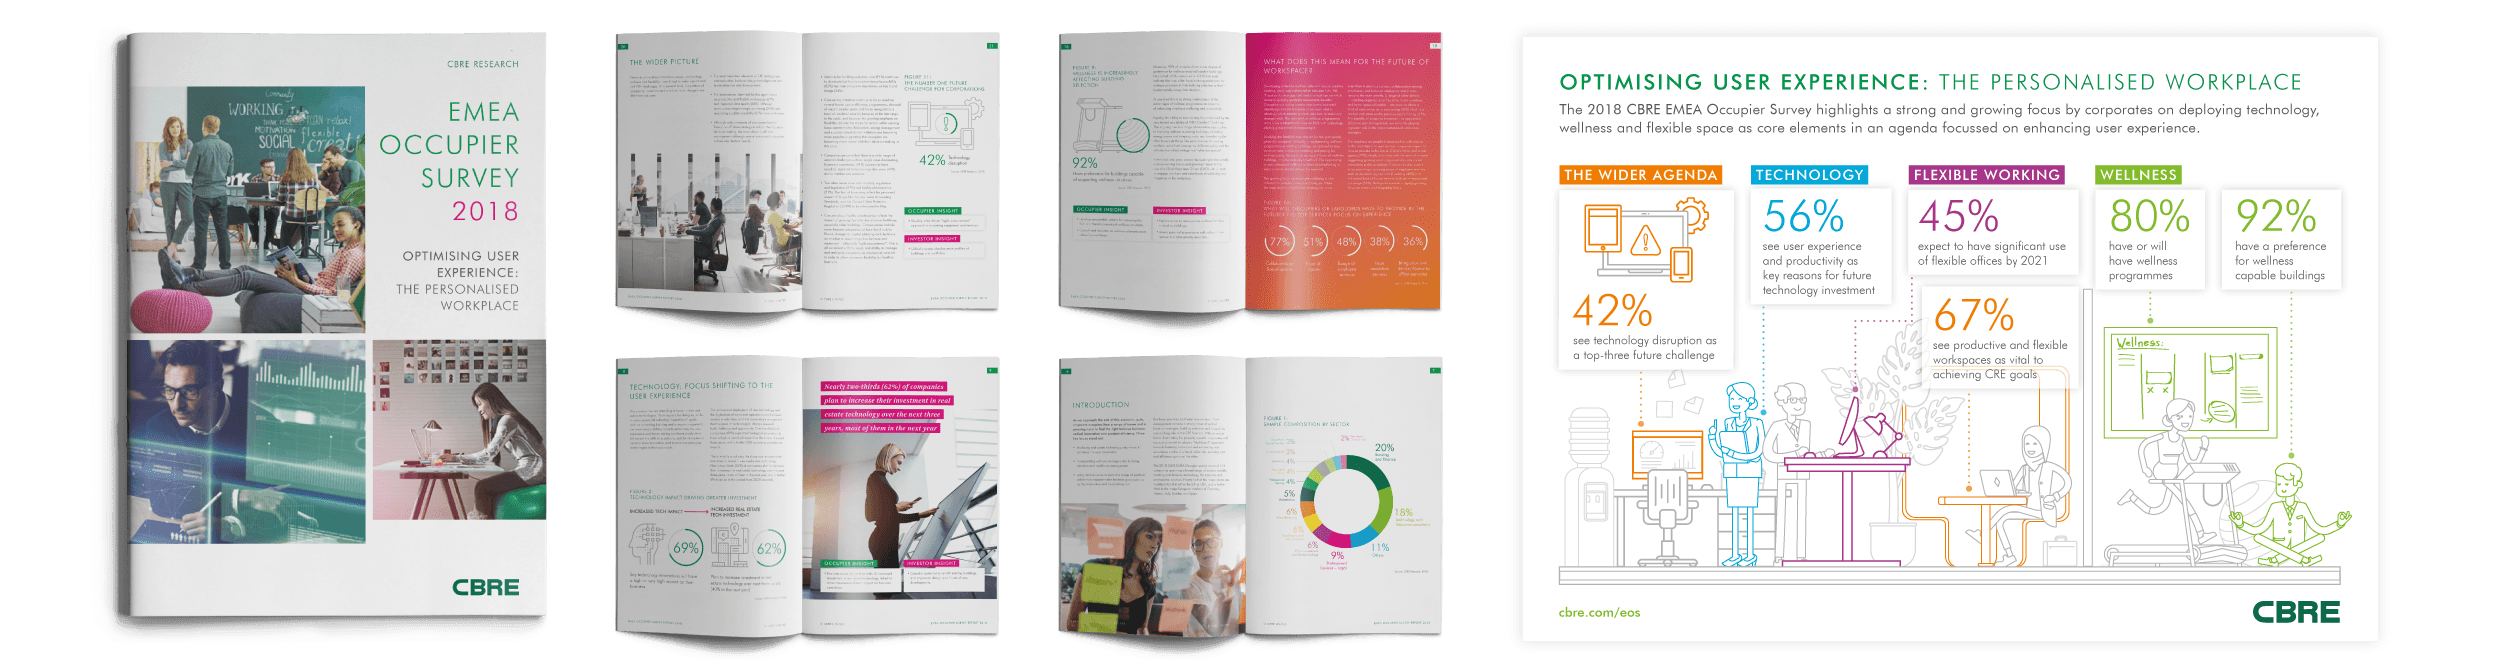
EMEA OCCUPIER SURVEY 2018
Editorial and infographics design of the report, creating a visual identity for it that was later translated to event graphics including stage and lantern design along with web assets and related social media posts.
Skills & tools
Adobe Illustrator
Adobe InDesign
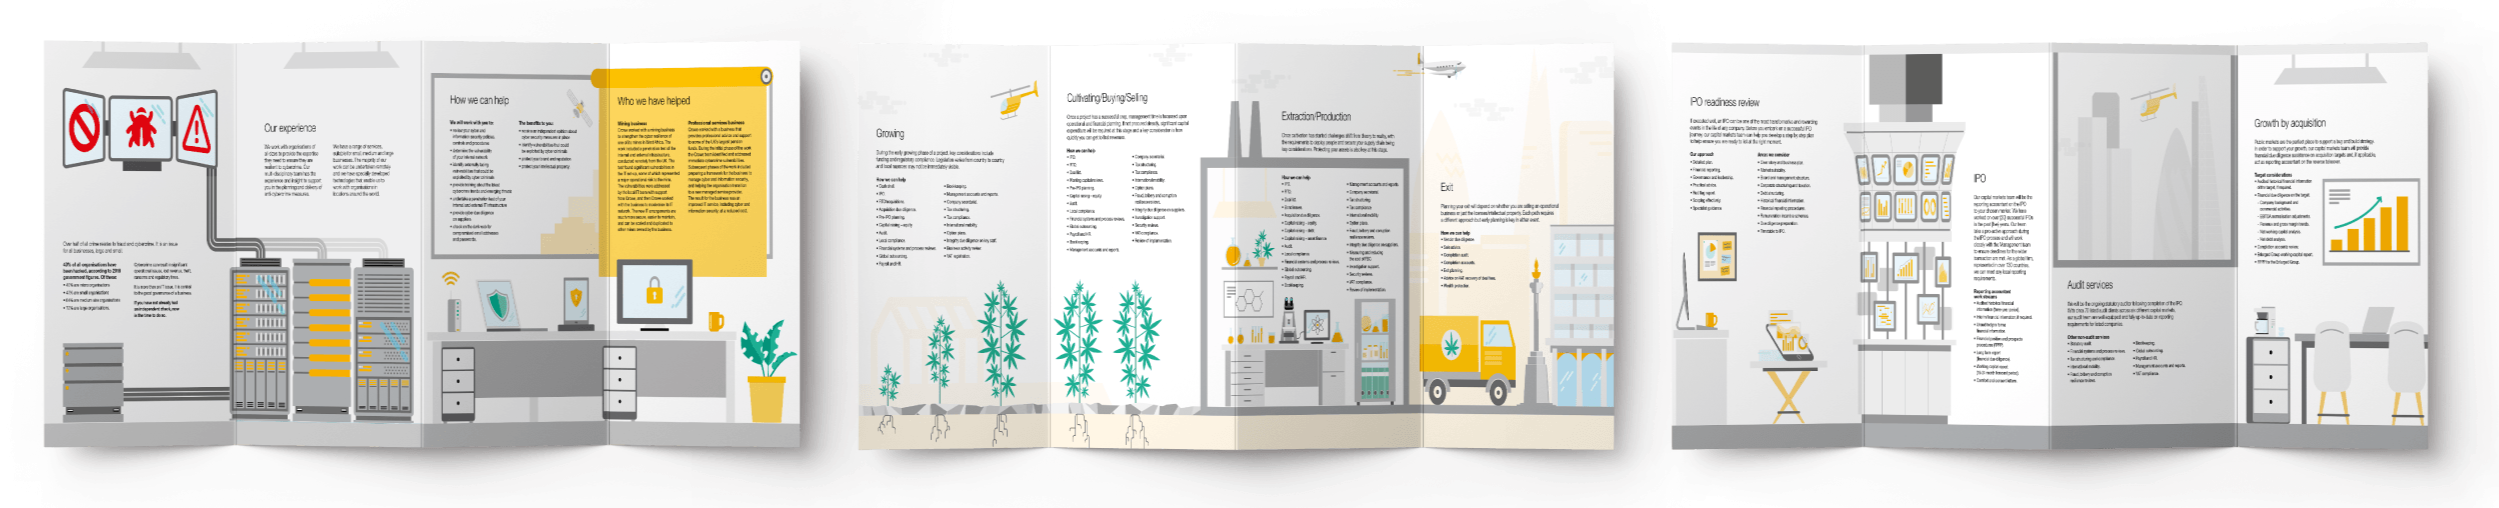
Project 07/07
LIFECYCLE GRAPHICS
Set of three 4-fold flyers explaining the different services of the company. Creating illustrations for these following brand’s guidelines and rules.
Skills & tools
Illustration
Adobe Illustrator
Adobe InDesign